Power BI tooling, model layer first

Drop a .bim or .tmdl.
Get a working Power BI report
in minutes.

BIMKit takes the schema you already have and gives you everything that's missing — a fully-explored model, realistic synthetic data, an AI that designs report pages, and a clean .pbip you can open in Power BI Desktop.

Free during private beta · Your production data never leaves your machine

OUT Working .pbip report
A BIMKit-designed Power BI dashboard with KPI cards, a trend chart, and a bar chart
333 tests passing
5 real .bim fixtures validated
14 visual types card · KPI · bar · line · matrix · …

You have the model.
You don't have data.

That's the position every Power BI developer ends up in eventually. The model is yours, but the data either doesn't exist yet, can't leave a secure environment, or is six tickets deep in someone else's queue. Every workaround is bad.

BIMKit is the layer that wasn't there. The schema goes in, a complete working report comes out — same model, same measures, same relationships. Just data you can actually use.

Four steps. One file in, one report out.

Each step takes seconds. Nothing leaves your machine unless you choose to send it.

  1. 01

    Upload

    Drag a .bim or .tmdl file in. BIMKit parses every detail — tables, columns, measures, hierarchies, partitions, M expressions, DAX. It validates the model and warns about issues at parse time.

    • Compatibility levels 1200–1604 supported
    • Calculated columns & tables detected and handled
    • Validates relationship integrity before generation
    BIMKit upload screen with drag-and-drop zone for .bim files
  2. 02

    Explore

    BIMKit builds an interactive ERD in seconds. Layered or force-directed layout, hover highlighting on relationships, hierarchy detection. Read your own model again — even the ones you inherited.

    • D3-rendered, zoomable, draggable
    • Star schema vs snowflake vs galaxy auto-classified
    • Bridge tables flagged for many-to-many handling
    BIMKit Explore tab showing an interactive Entity Relationship Diagram with four dimension tables and one fact table
  3. 03

    Generate

    Pick row counts (smart defaults are usually right). BIMKit generates synthetic data that's actually realistic — every foreign key resolves, every hierarchy is coherent, every column type is honoured.

    • Topological sort: dimensions first, facts second
    • Hierarchy coherence: no Aberdeen-in-South-West
    • Power-law cardinality for many-to-many bridges
    • Reproducible output with a seed
    BIMKit Generate panel showing per-table row count inputs for a star schema
  4. 04

    Design & Export

    Open the AI Report Designer. Tell it what you want: "executive overview," "trend by department," "add a margin measure." It writes the visuals onto a live canvas. Export to .pbip and open in Power BI Desktop. Done.

    • Provider-agnostic AI: Ollama · OpenAI · Claude
    • 14 visual types: card, KPI, bar, line, matrix, …
    • Auto-Design: rules-engine layout, no AI required
    • Export: .pbip (TMDL + PBIR) — git-friendly text
    BIMKit AI Report Designer with auto-designed dashboard showing KPI cards, trend chart, and bar chart

Everything you'd expect, plus the bits nobody else builds.

Six capabilities. Each one solves something specific you'd hit on real models.

/ the foundation

The most complete .bim parser in Python.

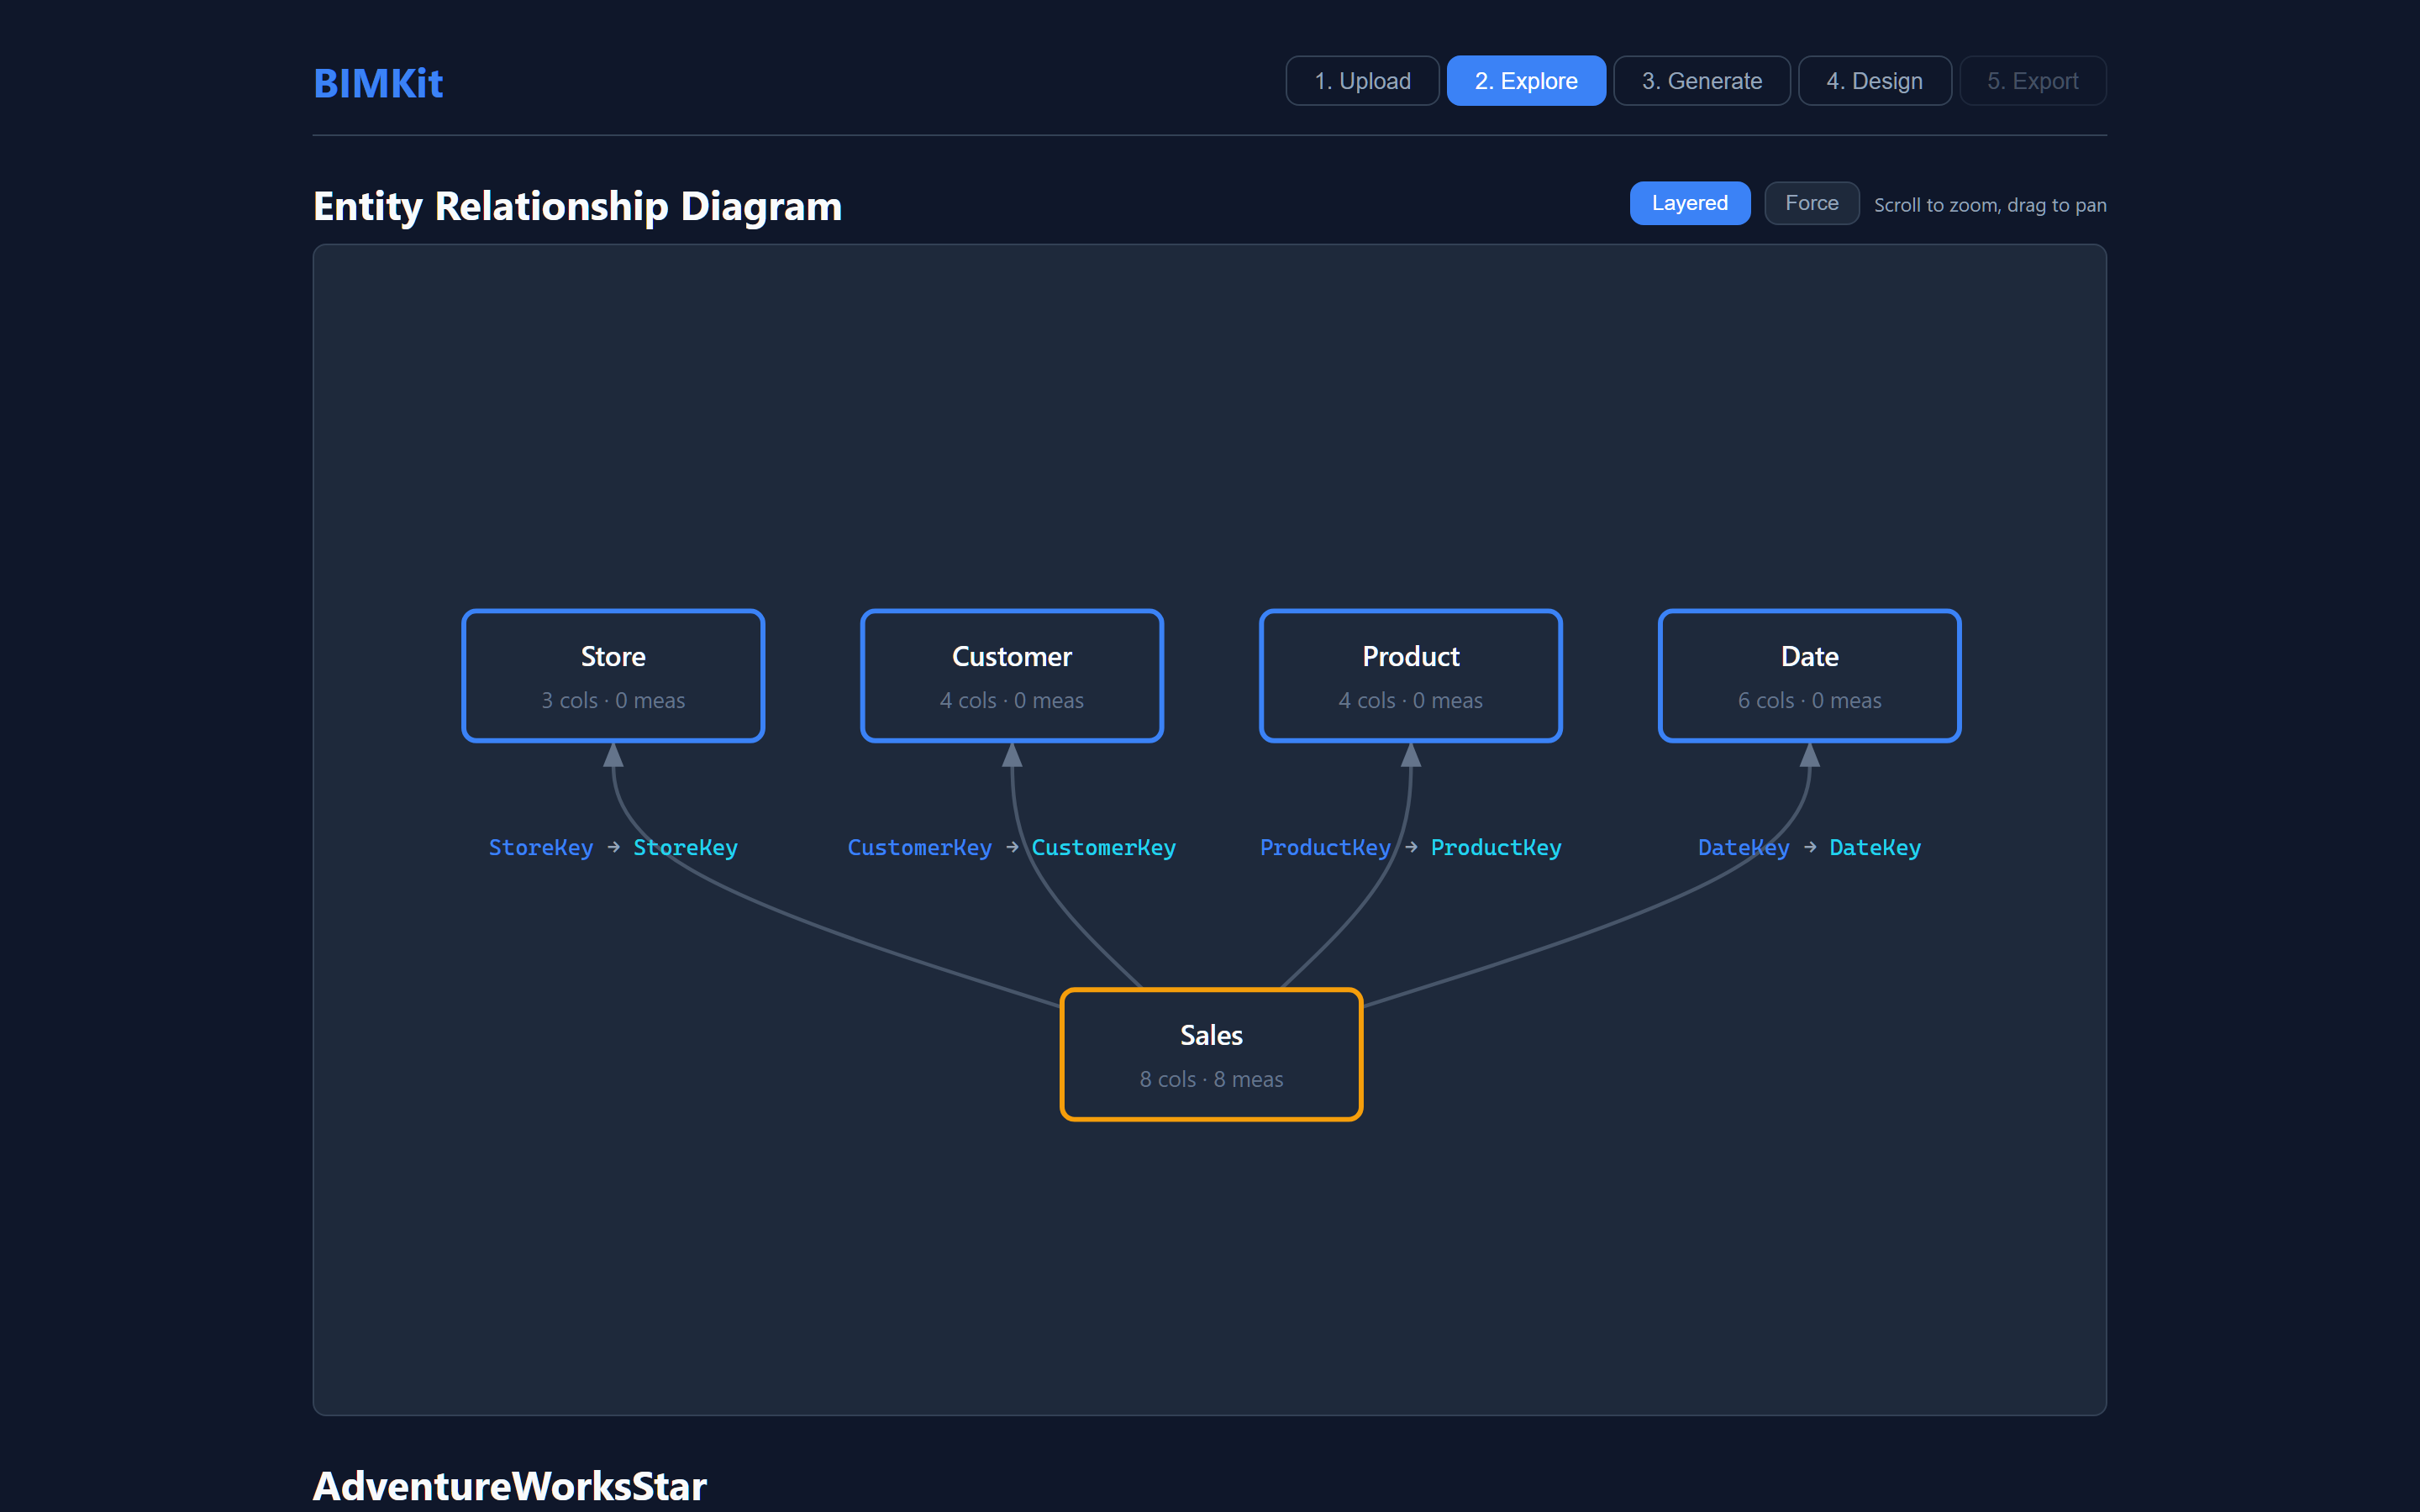
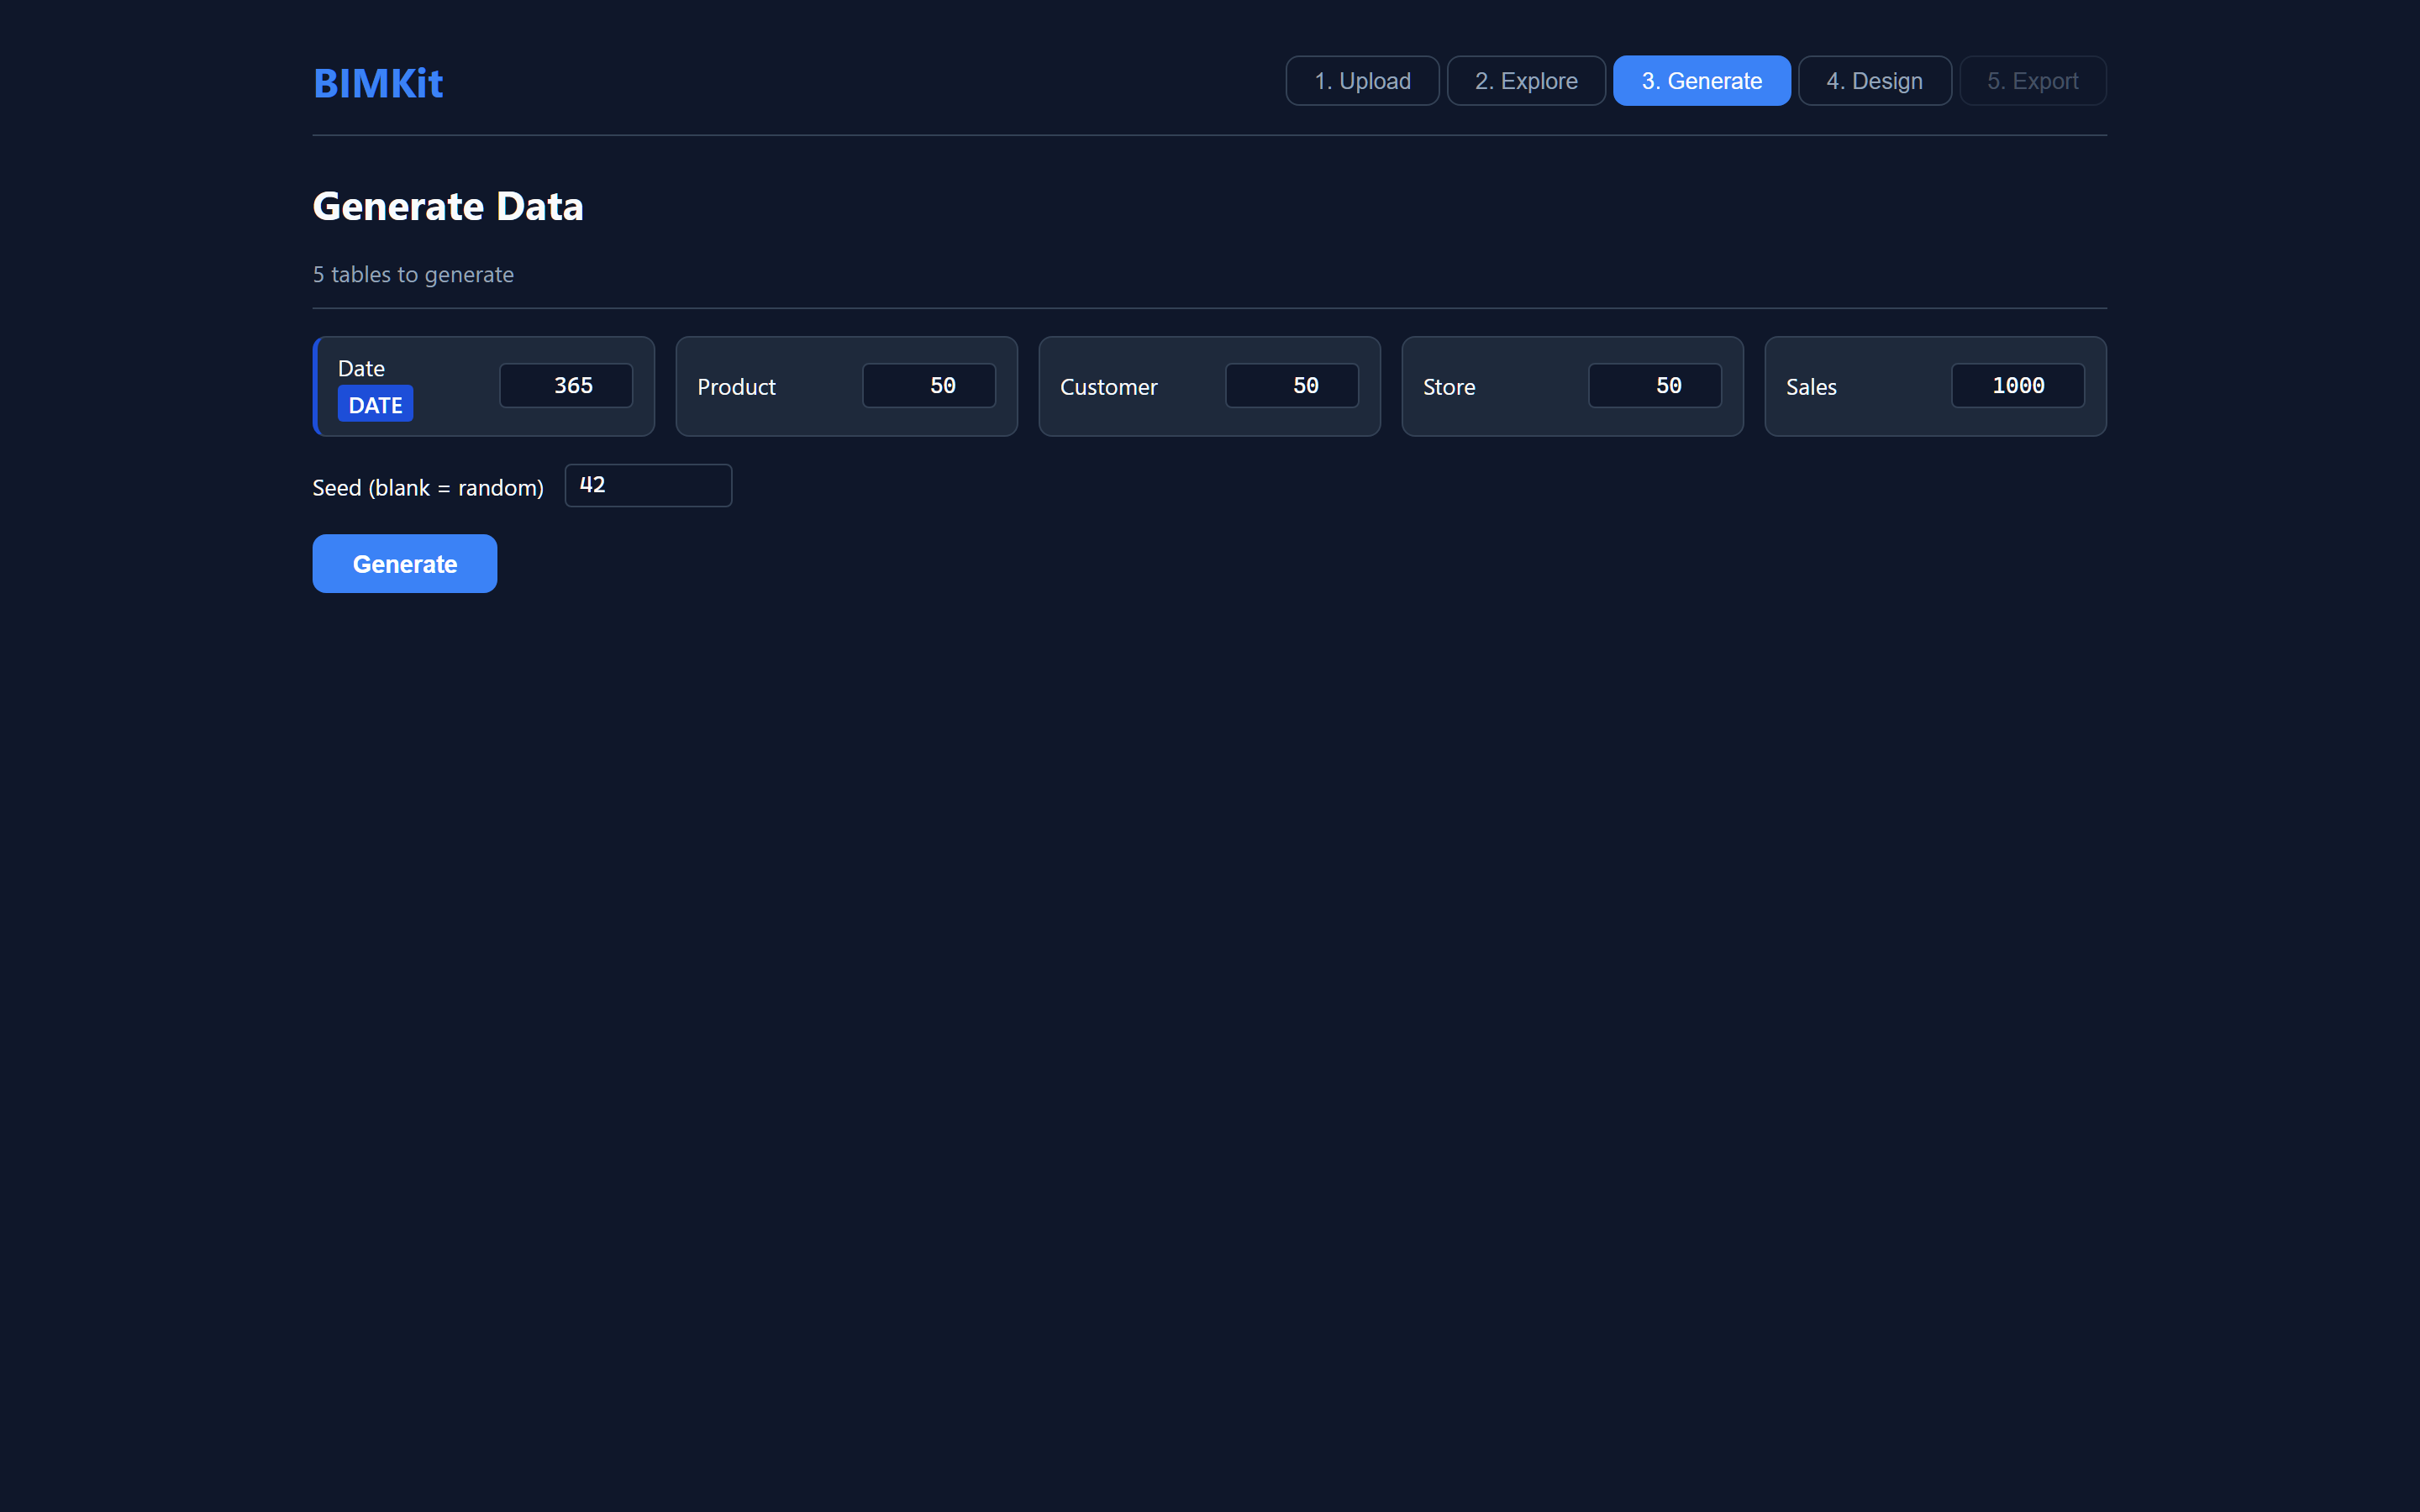
17 column properties. 14 table properties. Hierarchies, partitions, M expressions, DAX measures with format strings, calculation groups, RLS roles. It even parses DATATABLE literals so calculated lookup tables come through with their data intact — no DAX engine required.

  • Compatibility levels 1200–1604
  • 5 production fixtures, zero FK breaks
  • M expression lineage tracking

Synthetic data that's actually coherent.

Foreign keys resolve. Hierarchies hold together — Aberdeen lives in Scotland, not South West. Calendar tables get real Year/Quarter/Month relationships. Bridge tables model power-law cardinality so visuals don't look artificially flat.

AI Report Designer, conversational.

Chat with your model. The AI knows every measure, dimension, format string, and display folder. Ask for visuals, redesigns, new measures — it emits structured actions onto a live canvas. Provider-agnostic: Ollama, OpenAI, Claude.

Real DAX evaluation. Two engines.

Validate every measure against the data you just generated. DuckDB for fast, cross-platform DAX-style evaluation. Power BI Desktop via a managed Analysis Services subprocess for full-fidelity semantics. Auto-connects when Desktop is detected.

Export the whole thing as .pbip.

Skip the binary .pbix world. BIMKit emits a 100% text-based .pbip project — TMDL for the model, PBIR for the report layout. Diffs cleanly in git. Opens directly in modern Power BI Desktop.

Every Power BI visual that matters.

14 visual types — card, KPI, bar, column, line, area, combo, pie, donut, treemap, gauge, waterfall, scatter, table, matrix. The working set, not the toy set. All driven from generated data. All configurable on the canvas.

Built for real models, not tutorial fixtures.

A few of the things that took the longest to get right.

// M expression parsing

Source detection (CSV, SQL, web, OLE DB). Date-range extraction from List.Dates and #date(). Implicit FK lineage discovered from Table.NestedJoin chains. Column rename tracking through Table.RenameColumns.

// DATATABLE literal extraction

Calculated lookup tables defined entirely as DAX DATATABLE() expressions are parsed and the literal data preserved exactly — no DAX engine required.

// Hierarchy coherence

Geography of Country → Region → City uses a real lookup tree so child levels are valid descendants of their parent. Calendar of Year → Quarter → Month is derived from the date column on the same row.

// Bridge cardinality

Three profiles for many-to-many bridges: uniform, power-law (Zipf — the long tail you see in production), and clustered (models repeat-customer patterns).

// Adaptive AI prompts

The data dictionary scales with model size. Under 50 measures: full DAX, all columns. 50–200: compact form. 200+: minimal — names and format tags only. A 200-measure model fits where a naïve prompt would overflow.

// Prompt caching

The static prompt prefix (role, model context, dictionary) is marked with an Anthropic cache_control breakpoint. The first turn pays a small cache-write surcharge; subsequent turns within five minutes read at ~10% of normal input rate.

333tests passing
5real fixtures · AdventureWorks → custom
14visual types · D3-rendered
3AI providers · pluggable protocol
2DAX engines · DuckDB & PBI Desktop
0FK breaks · across all fixtures

Local or hosted. Same tool, two shapes.

Both editions run the same core. The only difference is whether Power BI Desktop integration is on the table.

Recommended for desktop

BIMKit Local

Windows desktop · single-binary portable app

  • Full Power BI Desktop integration — auto-connects, registers as External Tool, real DAX evaluation against your model
  • Local AI via Ollama — free, runs on your GPU, no API bills
  • Bring-your-own-key for Claude or OpenAI if you prefer
  • Nothing leaves your machine — models, data, chats, exports
For anywhere access

BIMKit Hosted

Web-deployed · use from any browser

  • AI Report Designer with Claude — prompt-cached for cost efficiency
  • DuckDB DAX evaluation — cross-platform, no Windows dependency
  • .pbip export — same output, downloadable as a zip
  • No PBI Desktop integration — your local Desktop instance isn't reachable from a hosted box
  • Basic Auth gate — just you, your URL

Both read the same .bim, generate the same data, design the same reports, export the same .pbip. Use either, or both, depending on the day.

Free during private beta. Pro tier coming with the public launch — drop a message for an invite.

Frequently asked.

What model formats does BIMKit accept?

.bim (TMSL) — the JSON serialisation of a tabular model, exported by Tabular Editor 2 and emitted indirectly by Power BI Desktop via .pbit/.pbip. Still the most common format in the wild.

.tmdl (TMDL) — the modern human-readable, indent-based successor to TMSL. GA since August 2024 and the default in new Power BI Project (PBIP) folders. BIMKit reads single-document TMDL exports directly.

Drop either format on the upload zone — BIMKit sniffs the content and dispatches automatically.

Does BIMKit modify my actual model?

No. The parser is read-only. Generated data and any AI-created measures live in the BIMKit canvas and the exported .pbip — never written back to the source .bim.

What about my real production data?

Local edition: your real data never enters BIMKit, since BIMKit only reads the .bim structure.
Hosted edition: your .bim is parsed in memory on the server and discarded. Generated synthetic data and AI chat history live in your browser session, not on our servers.

How big a model can it handle?

Tested clean against AdventureWorks 2 (14 tables, 22 relationships, 58 measures, 203 columns) and a custom 33-table production fixture. Adaptive prompt sizing keeps the AI workable at scale; the parser is unbounded.

Which AI providers are supported?

Ollama (local, free, default for desktop), OpenAI (GPT-4o family), and Anthropic (Claude Haiku, Sonnet, Opus). Provider-agnostic protocol — adding a new one is a single Python file. Hosted edition defaults to Claude Haiku for cost efficiency.

What if the AI gets DAX wrong?

Every AI-generated measure is run through real DAX evaluation against the generated data — DuckDB on hosted, DuckDB or Power BI Desktop locally. Errors are surfaced explicitly, not silently skipped.

Why does Local need Windows?

Only the Power BI Desktop integration does — that's a Windows-only Microsoft product. The rest of BIMKit (parser, generator, DuckDB DAX engine, AI, PBIP export) runs anywhere. Hosted is the cross-platform path.

Is it open source?

Currently a private project in beta. Get in touch below if you'd like access, want to talk roadmap, or have a specific use case in mind.

Want to try it?

Send a message — I'll get back to you. Particularly interested in models that break something interesting.